

Portfolio Analysis
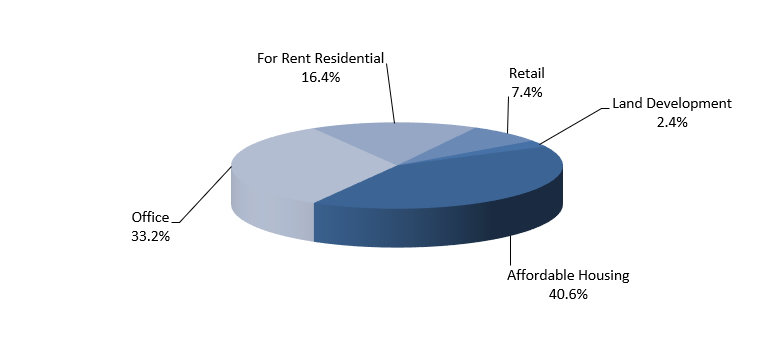
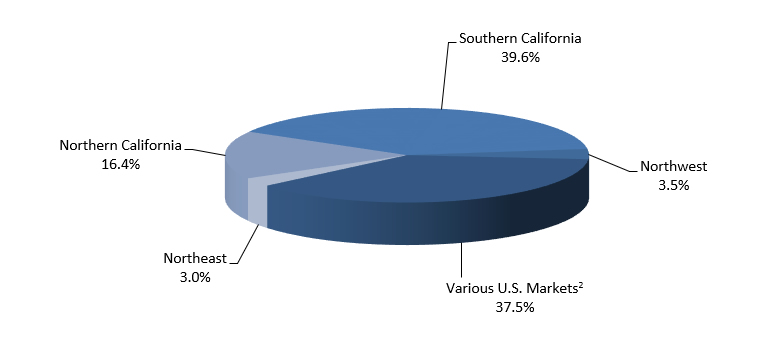
Portfolio Allocation
(based on NAV as of 12/31/23)1
Property Type
Region
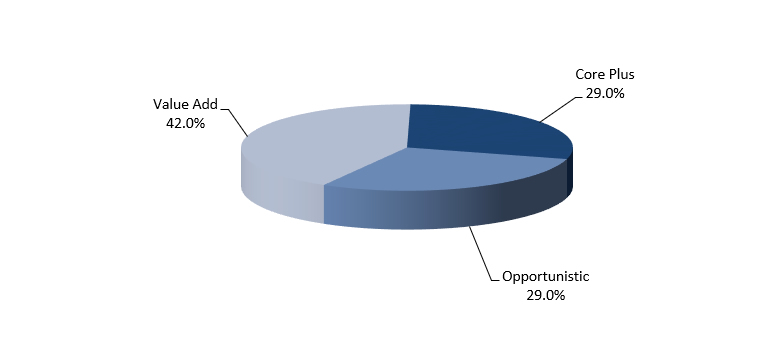
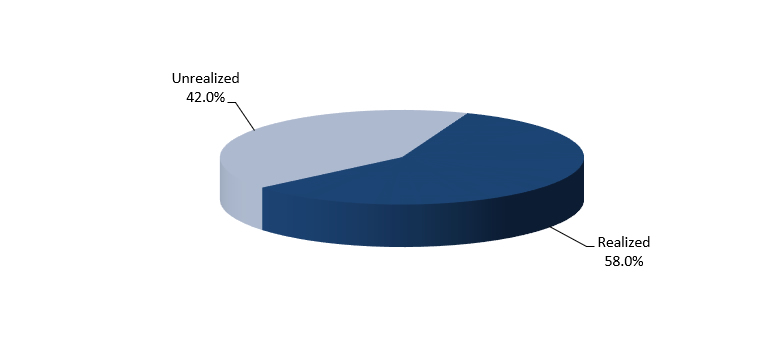
Direct Investments (2007 – 2023)3
Risk Profile
Realized vs. Unrealized
(1) The percentages noted in the pie charts are calculated using the 12/31/23 NAV for each RMA direct investment.
(2) Various U.S. Markets include Mid-Atlantic, Midwest, Southeast, Southwest, Hawaii, the Rockies and investments with a broad, nationwide investment focus.
(3) Percentage calculated based on number of investments.